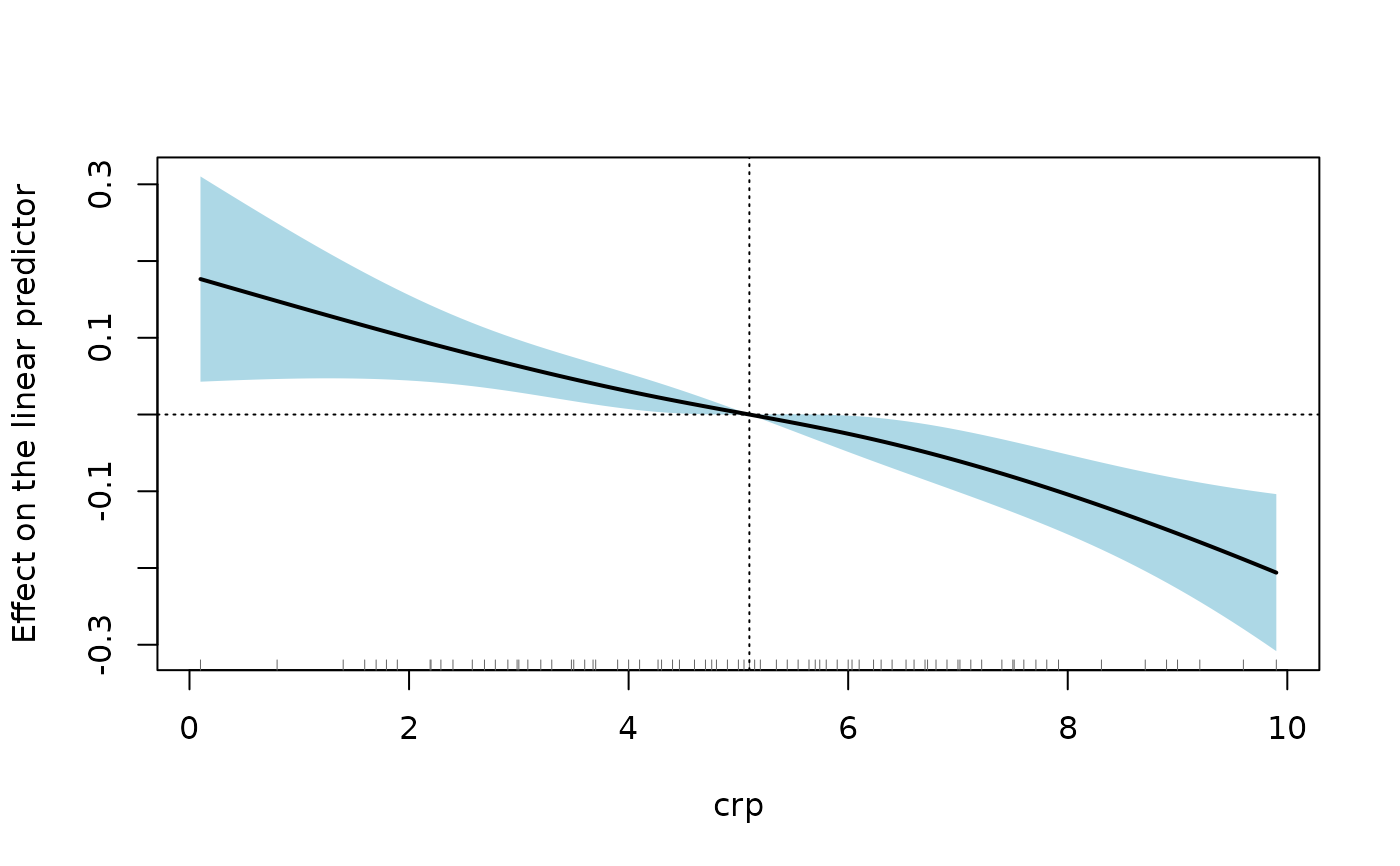
Draws the estimate as a line over a shaded pointwise confidence band, a rug of the percentiles of the observed regressor, and dotted reference lines: at zero and at the reference value for link-scale curves, at zero for slope curves. Curves by group share one panel, one colour each, with a legend. Curves of a discrete regressor are drawn as points with confidence whiskers.
Arguments
- x
a
"panglm_effectcurve"object fromeffectcurve()- xlab, ylab
axis labels;
ylabdefaults to a label for the scale- band_col
colour of the confidence band (single curve)
- rug
if
TRUE, mark the percentiles of the observed regressor on the horizontal axis- col
colour(s) of the curve(s); black for a single curve and the Okabe-Ito palette for curves by group by default
- legend
position of the legend for curves by group:
"auto"(the corner of the plot least covered by the curves and bands), a keyword accepted bygraphics::legend(), orFALSEfor none- ...
passed to
graphics::plot()
See also
Other panglm methods:
coefplot(),
confint.panglm(),
effectcurve(),
fitted.panglm(),
fixef(),
glance.panglm(),
logLik.panglm(),
model.matrix.panglm(),
partialeffects.panordered(),
plot.panglm(),
plot.panglm_ape(),
predict.panglm(),
predict.panordered(),
residuals.panglm(),
summary.panglm(),
tidy.panglm(),
vcov.panglm()