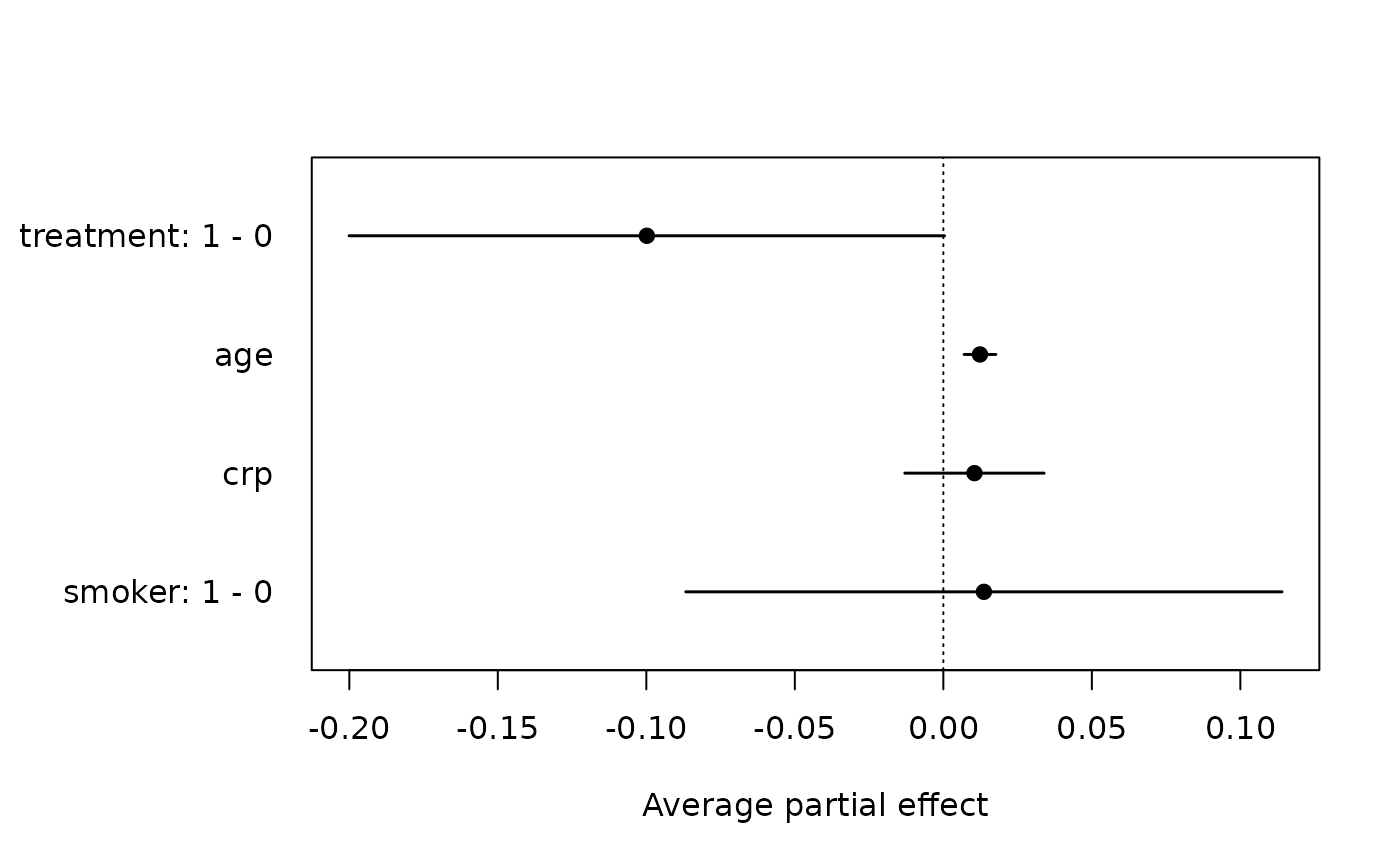
Dot-and-whisker plot of the average partial effects returned by
partialeffects(): one row per continuous or binary regressor and per
non-reference factor level, the estimate as a dot, its Wald confidence
interval as a horizontal segment and a dotted reference line at zero. The
left margin is widened to fit the row labels and restored on exit. For
two-part models the part of the mean ("total", "binary" or
"positive") is shown in the axis label; plot one object per part to
compare them.
Usage
# S3 method for class 'panglm_ape'
plot(x, labels = NULL, xlab = NULL, main = NULL, col = "black", pch = 19, ...)
Arguments
- x
a
"panglm_ape"object frompartialeffects()- labels
row labels; by default the variable name for continuous regressors and
"variable: contrast"for discrete ones- xlab
horizontal-axis label
- main
plot title
- col
colour of the dots and whiskers
- pch
plotting symbol of the estimates
- ...
passed to
graphics::plot.default()
See also
Other panglm methods:
coefplot(),
confint.panglm(),
effectcurve(),
fitted.panglm(),
fixef(),
glance.panglm(),
logLik.panglm(),
model.matrix.panglm(),
partialeffects.panordered(),
plot.panglm(),
plot.panglm_effectcurve(),
predict.panglm(),
predict.panordered(),
residuals.panglm(),
summary.panglm(),
tidy.panglm(),
vcov.panglm()