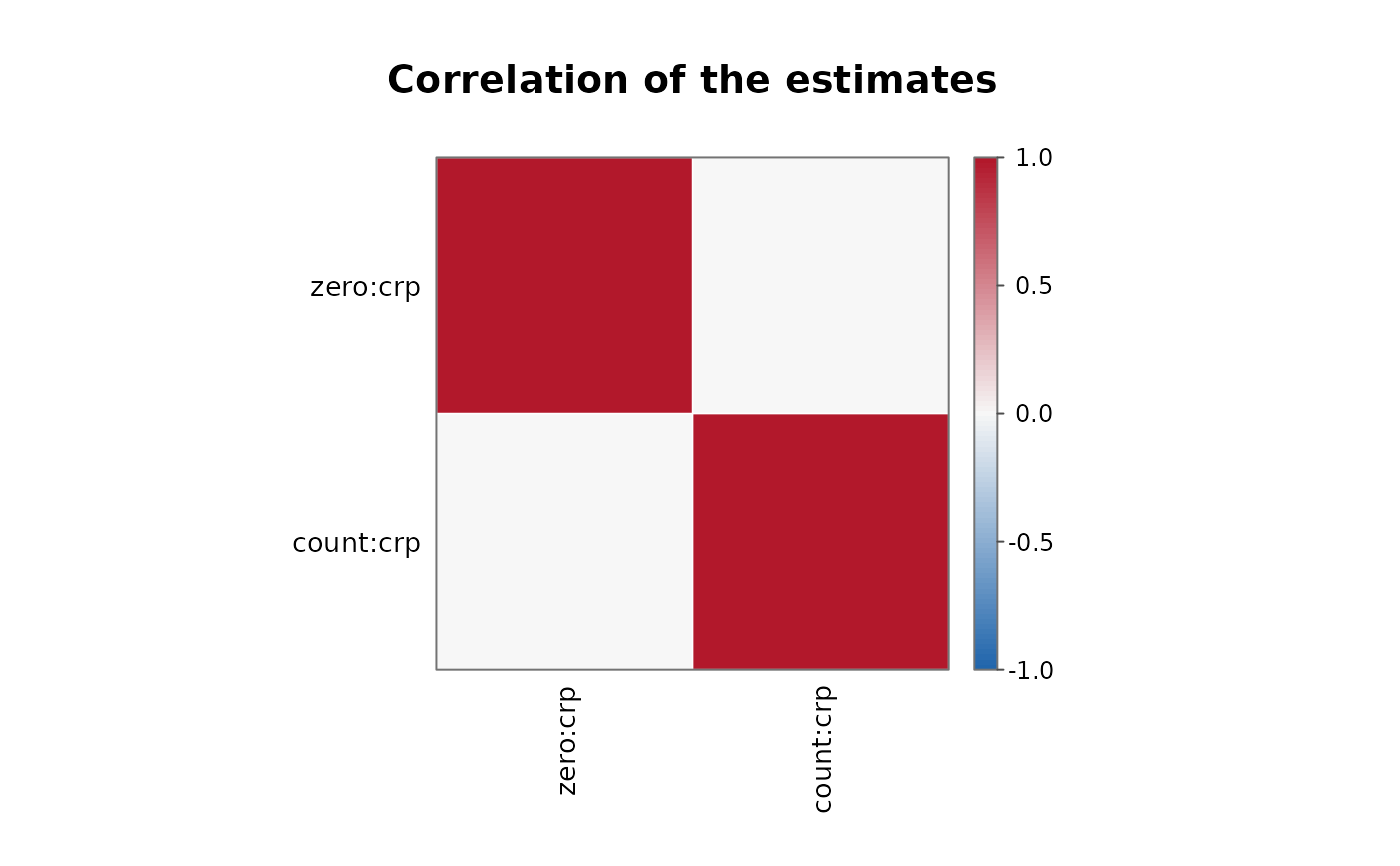
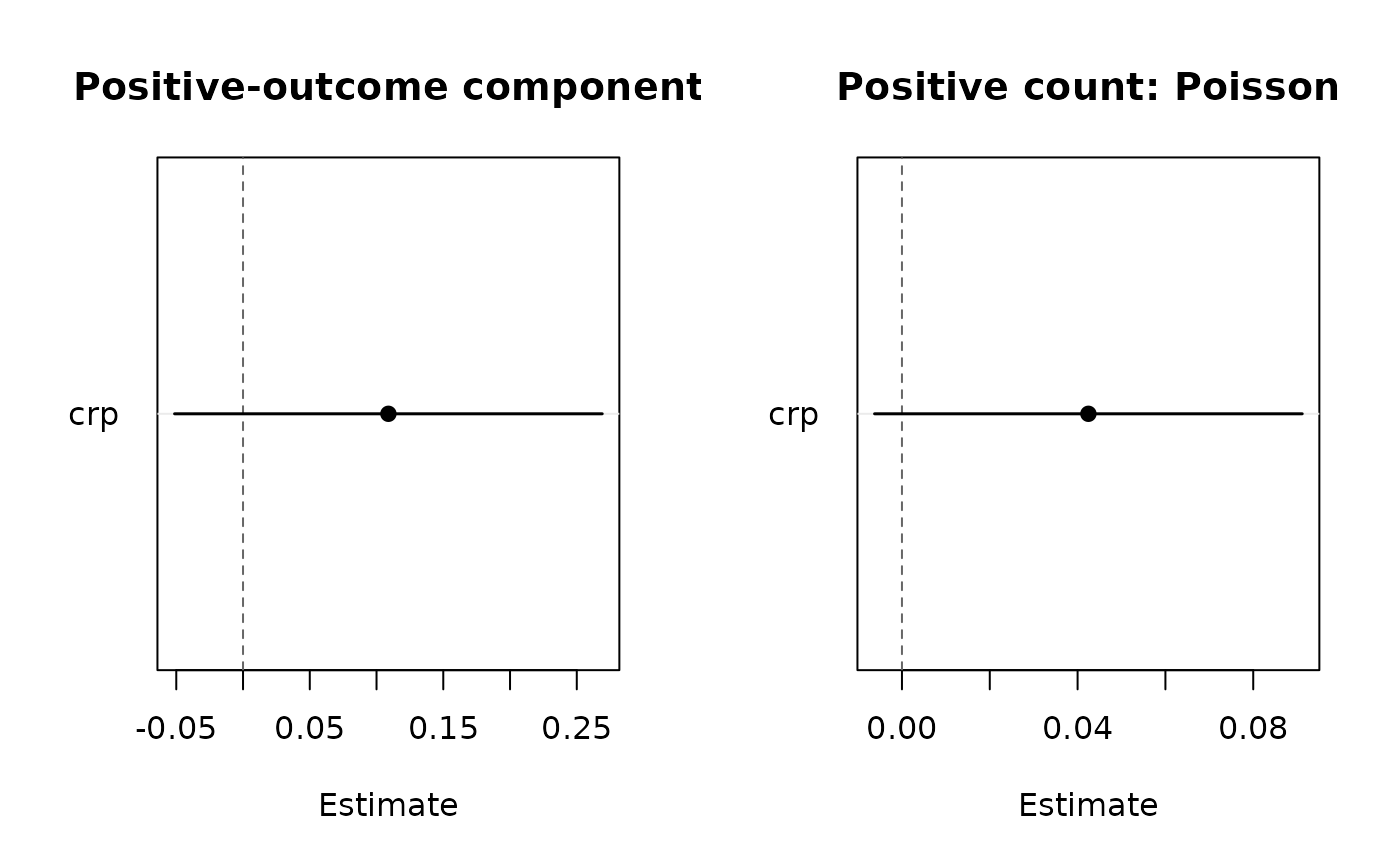
Displays coefficient estimates and Wald confidence intervals for the
binary hurdle component, the positive-count component, or both, in the
dot-and-whisker layout of plot.panglm(). which = "correlation" draws
the heatmap of the correlation matrix of all the estimates (see
plot.panglm()); the two parts are estimated separately, so the
between-part block is zero.
Arguments
- x
a fitted
"panglm_hurdle"object- which
one of
"both","zero","count"or"correlation"- level
confidence level for coefficient intervals
- parm
names or positions of the terms to plot; by default every term except
"(Intercept)". For"correlation", names as incoef(x)(with thezero:andcount:prefixes).- cells
for
"correlation", print the correlation in each cell- ...
additional arguments passed to
graphics::plot.default()
See also
Other panhurdle methods:
hurdle-methods
Examples
data(copd)
fit <- panhurdle(exacerbations ~ crp, data = copd,
index = c("id", "visit"))
#> 26 group(s) with no within-group outcome variation dropped (all-0 or all-1) -- they carry no information for the conditional likelihood.
#> 6 group(s) whose positive counts are all 1 dropped from the count part -- their intercept is not finite and they carry no information.
plot(fit)
 plot(fit, which = "correlation")