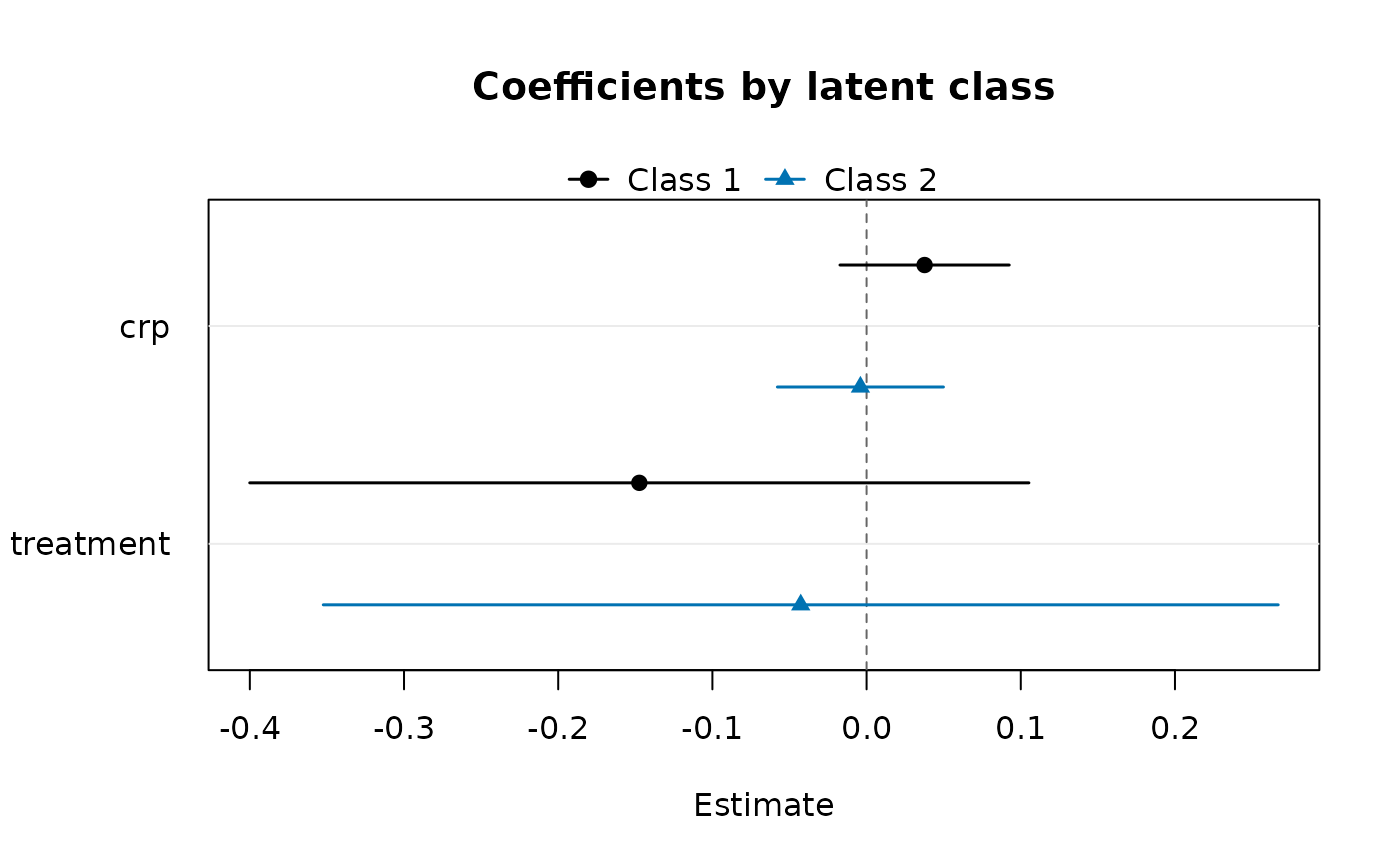
which = "coefficients" compares the coefficients of the latent classes
in one dot-and-whisker panel (the classes dodged within each term, as in
coefplot()); the coefficients of the class-membership (concomitant)
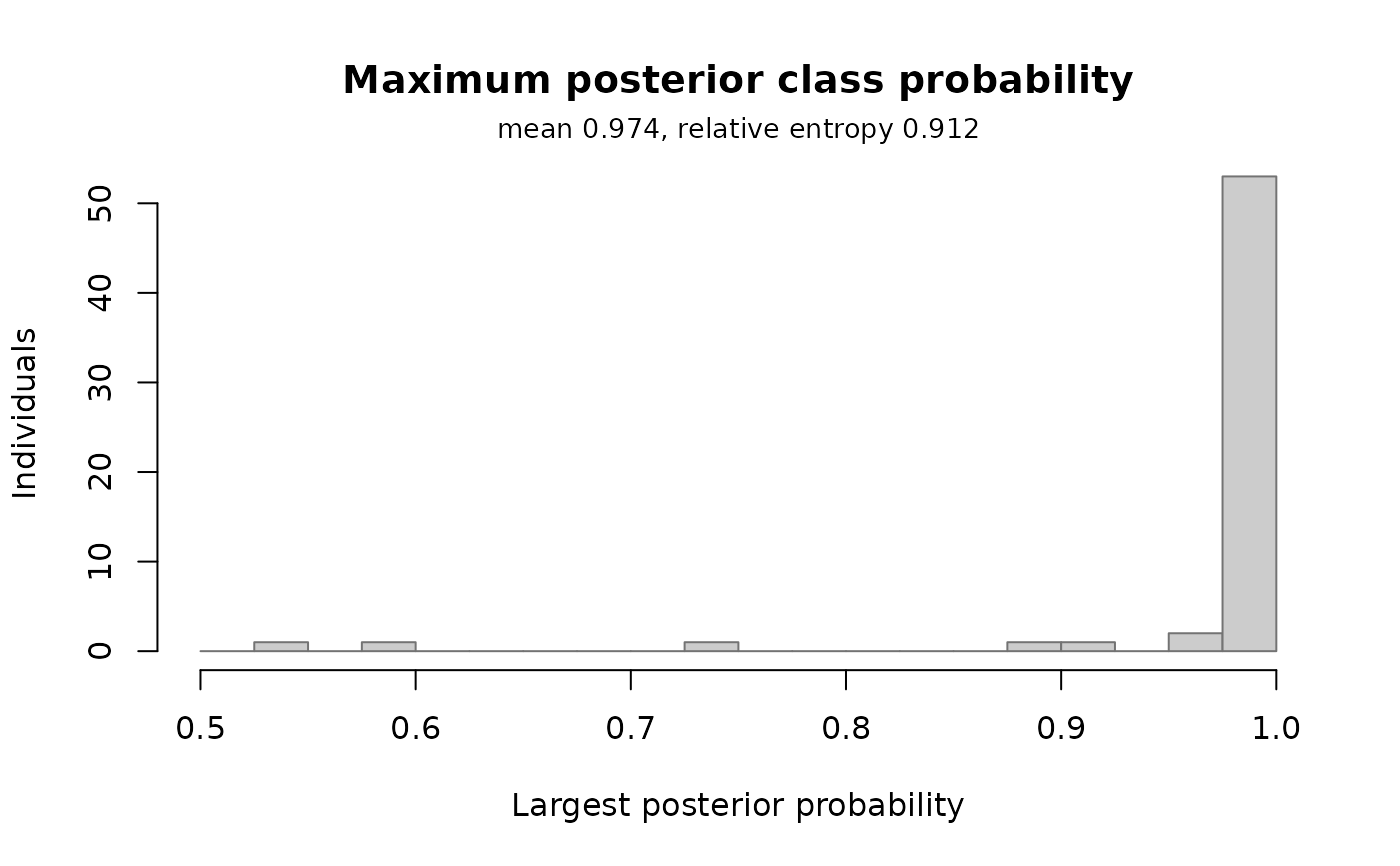
model are not shown. which = "posterior" is a classification-quality
diagnostic: the histogram of each individual's largest posterior class
probability. Mass close to one means well-separated classes; the
subtitle reports its mean and the relative entropy
1 - sum(-p log p) / (N log k) (one for a perfect classification).
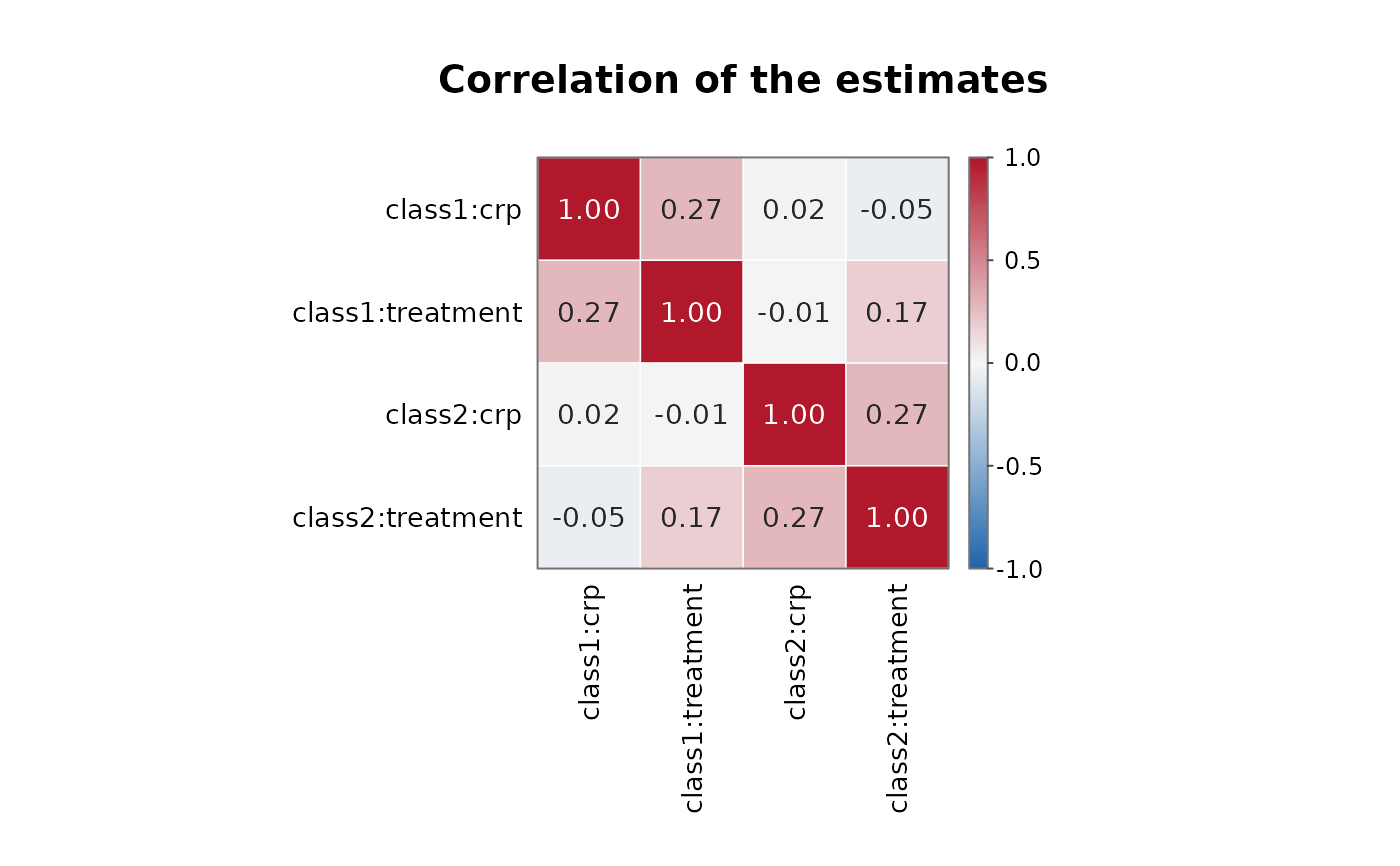
which = "correlation" draws the heatmap of the correlation matrix of
all the estimates, cov2cor(vcov(x)) (see plot.panglm()).
Arguments
- x
a fitted
"panfmm"object- which
"coefficients"(default),"posterior"or"correlation"- parm
names or positions of the terms to plot (without the class prefix); by default every term except
"(Intercept)". For"correlation", names as incoef(x).- level
confidence level of the intervals
- cells
for
"correlation", print the correlation in each cell- main
optional plot title
- xlab
optional horizontal-axis label
- ...
additional arguments passed to
graphics::plot.default()
See also
Other panfmm methods:
predict.panfmm(),
summary.panfmm(),
vcov.panfmm()